
Verified Collabstr Creators Average 5.7% Engagement, so What Is a Good Engagement Rate?
If you are sizing up a creator before you hire, this guide shows what engagement rate is typical by platform and format, how to calculate one and how to judge the rate a creator gives you.
Key Takeaways
• A good engagement rate is at or above the average for creators on the same platform and format, calculated the same way. Verified creators on Collabstr average 5.7% (Collabstr platform data, July 2026), and Collabstr's Instagram calculator calls 1% to 3% average on Instagram.
• In Collabstr's 2026 Influencer Marketing Report, YouTube videos engaged at 6% and TikTok videos at 2%, a 3x gap between formats.
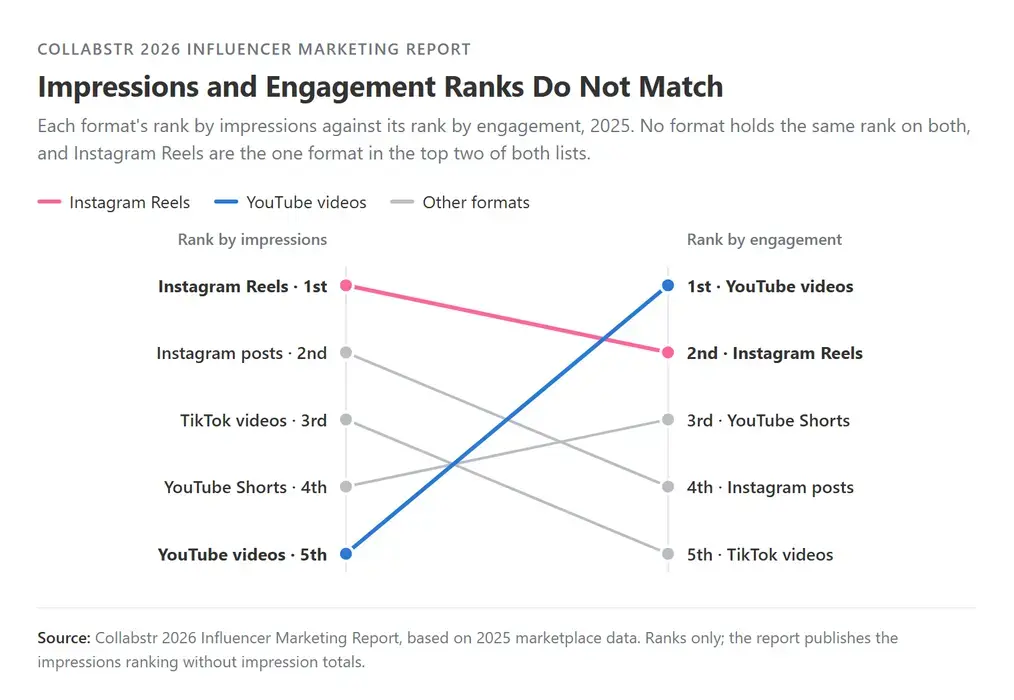
• In the same report, no format holds the same rank on impressions (the number of times content was shown) and on engagement. Instagram Reels are the one format in the top two of both lists.
• Judge a creator against peers measured the same way and against their own typical post, then read the comments.
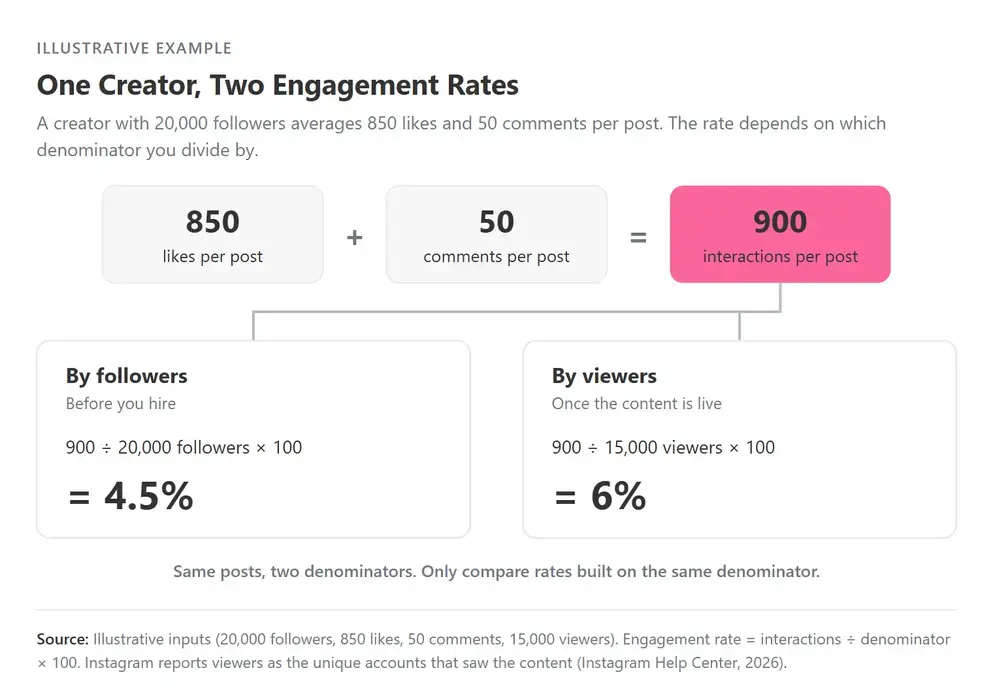
Engagement rate is the number of likes, comments and other interactions a post gets, divided by the size of the audience, times 100. The catch is which audience number you divide by. Here is a hypothetical example:
1. A creator has 20,000 followers and averages 850 likes and 50 comments per post, 900 interactions in all.
2. By followers, the rate is 900 ÷ 20,000 × 100 = 4.5%.
3. If 15,000 accounts saw each post, the rate by viewers is 900 ÷ 15,000 × 100 = 6%.
Same creator, same posts, two rates.
What Is a Good Engagement Rate?
A good engagement rate sits at or above the average for its platform, format and calculation method, and holds across a creator's recent posts. Our Instagram calculator calls 1% to 3% average on Instagram, calculated by followers (Collabstr, 2026). Good starts where a creator's audience responds more than that, with comments that read like a real audience.
Verified Collabstr Creators Average 5.7%
The average verified engagement rate across creators in Collabstr's data is 5.7% (Collabstr platform data, July 2026). Verified means the creator has connected their social account, so Collabstr reads the numbers directly from the platform (Collabstr, 2026). The figure comes from live creator profiles on July 23, 2026, averaged across every niche, or content category, and covers the 84% of live creators with an engagement rate on file.
The 5.7% comes from connected accounts, while the calculator's 1% to 3% comes from its own sample of accounts, so do not hold one against the other. For another reference point, our calculator puts the average Instagram influencer at 2.39% by followers (Collabstr, 2026).
Why Verified Creators Run Higher
Two factors can contribute to the 5.7% average: the rate is verified, and most creators on Collabstr have smaller accounts.
The rate is verified. It comes from live creators with verified, public, active accounts, read directly from each connected account, so it reflects how each account performs.
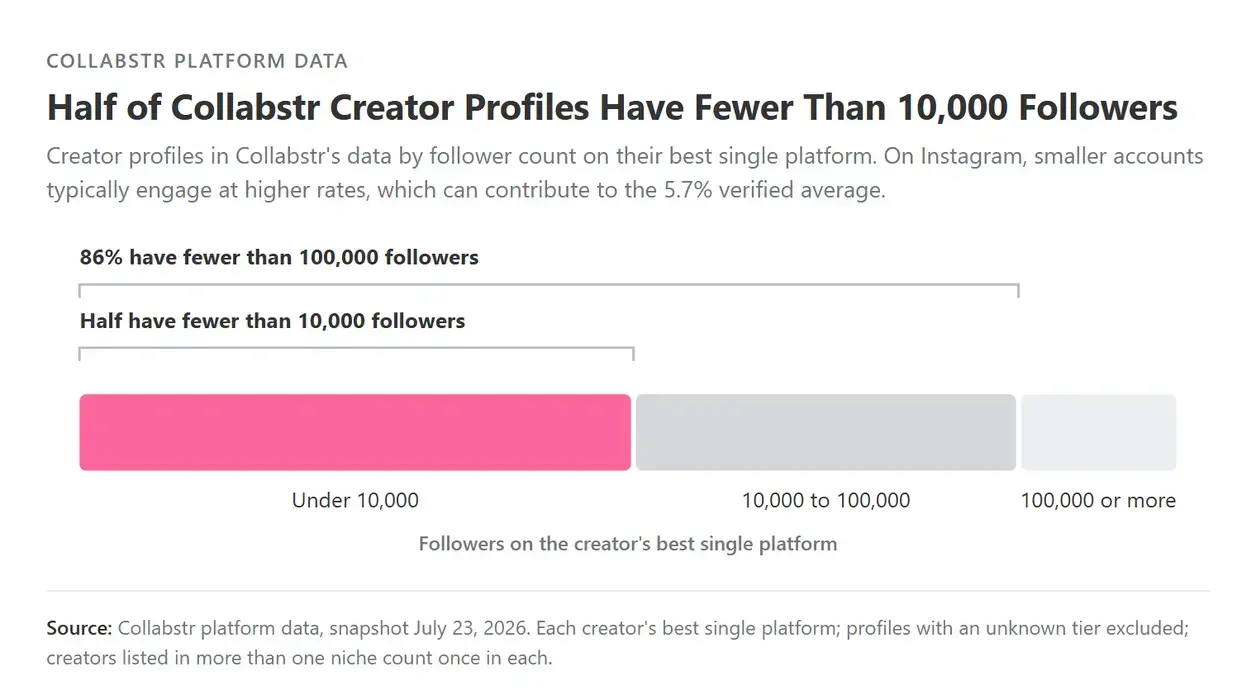
Most creators have smaller accounts. Half of creator profiles in Collabstr's data have fewer than 10,000 followers on their best single platform, and 86% have fewer than 100,000 (Collabstr platform data, July 2026). On Instagram, smaller accounts typically engage at higher rates, and our Instagram calculator notes that the more followers an account has, the harder a high rate becomes. Our nano versus micro guide covers how size changes what you get.
How Engagement Rate Changes by Format
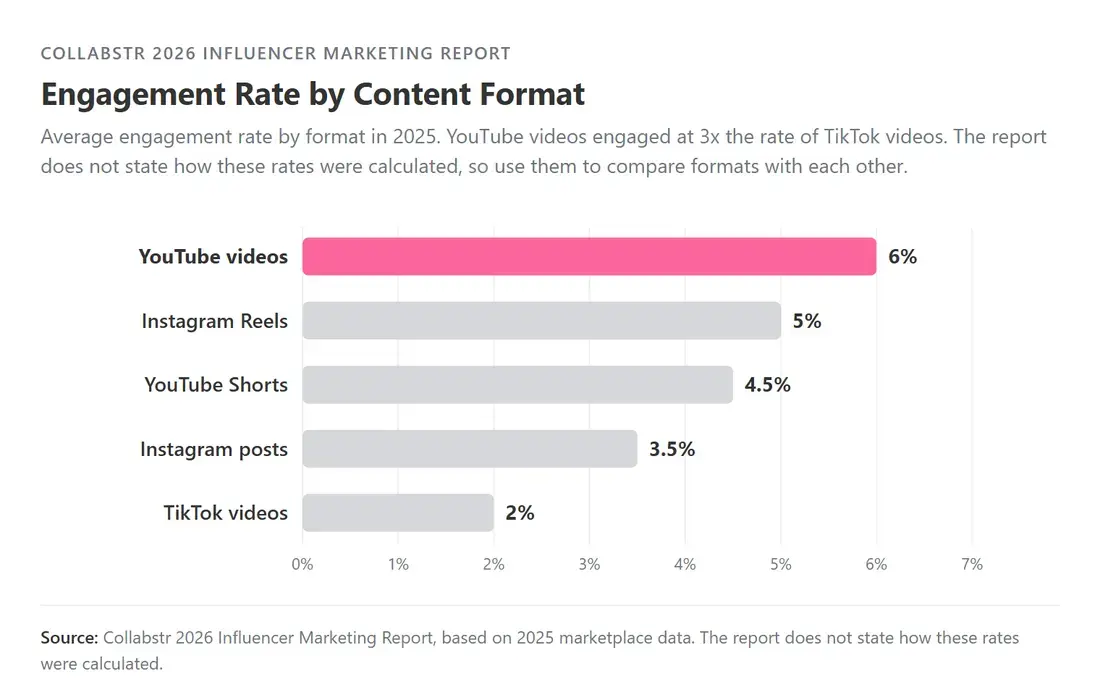
Engagement rate changes by format by as much as 3x: YouTube videos averaged 6% and TikTok videos 2% in our 2026 Influencer Marketing Report, based on 2025 marketplace data (Collabstr, 2026). The report does not say which audience number those rates divide by, so use them to see how widely formats differ, and check individual profiles with the calculators.
Average Engagement Rate by Format
Of the five formats in the report, Instagram Reels, YouTube Shorts and Instagram posts sit between YouTube videos at the top and TikTok videos at the bottom.
|
Format |
Engagement rate |
Multiple of TikTok videos |
Rank by impressions |
|---|---|---|---|
|
YouTube videos |
6% |
3.0x |
5th |
|
Instagram Reels |
5% |
2.5x |
1st |
|
YouTube Shorts |
4.5% |
2.3x |
4th |
|
Instagram posts |
3.5% |
1.8x |
2nd |
|
TikTok videos |
2% |
1.0x |
3rd |
Impressions and Engagement Ranks Do Not Match
No format holds the same rank on impressions and engagement. The report ranks YouTube videos last on impressions and first on engagement, and Instagram Reels are the one format in the top two of both lists. One possible reading: formats built for reach spread content to people who have not chosen to follow the creator, while formats people seek out, such as a full YouTube video, draw a smaller audience that responds more.
Why One Engagement Number Misleads
The same platform can produce engagement rates as far apart as 2% and 17.5%, depending on the data and the method behind them. In our report, TikTok videos average 2%. Our TikTok calculator, which divides likes and comments by followers, puts the average TikTok influencer at 17.5% (Collabstr, 2026).
One likely reason for the gap: TikTok shows videos to many people who do not follow the creator, so interactions divided by followers can come out high. The report does not say how its 2% was calculated, so treat the two figures as separate measures and compare a creator only with the one that matches your method.
How to Calculate Engagement Rate
Engagement rate is interactions divided by an audience number, called the denominator (followers, viewers or views), multiplied by 100. Interactions are likes plus comments, with saves and shares added where the platform shows them. Our calculators count likes and comments only, so count the same interactions whenever you compare two creators.
Three Ways to Count the Audience
You can divide by followers, viewers or views. Followers (subscribers on YouTube) work before you hire, and viewers or views work once the content is live.
• By followers: interactions divided by followers, times 100. It uses public numbers, so it works before you reach out. Our Instagram and TikTok calculators both use this method, averaging likes and comments across 12 to 24 recent posts.
• By viewers: interactions divided by the unique accounts that saw the content, times 100. It needs the creator's own insights, which Instagram defines as the unique accounts that have seen your content on screen at least once (Instagram Help Center, 2026).
• By views: interactions divided by views, times 100. Views count every play, so one person can add more than one. Use it for short and long video, as the table below shows.
A Worked Example
The chart below shows the example from the introduction: 900 interactions are 4.5% of 20,000 followers and 6% of 15,000 viewers.
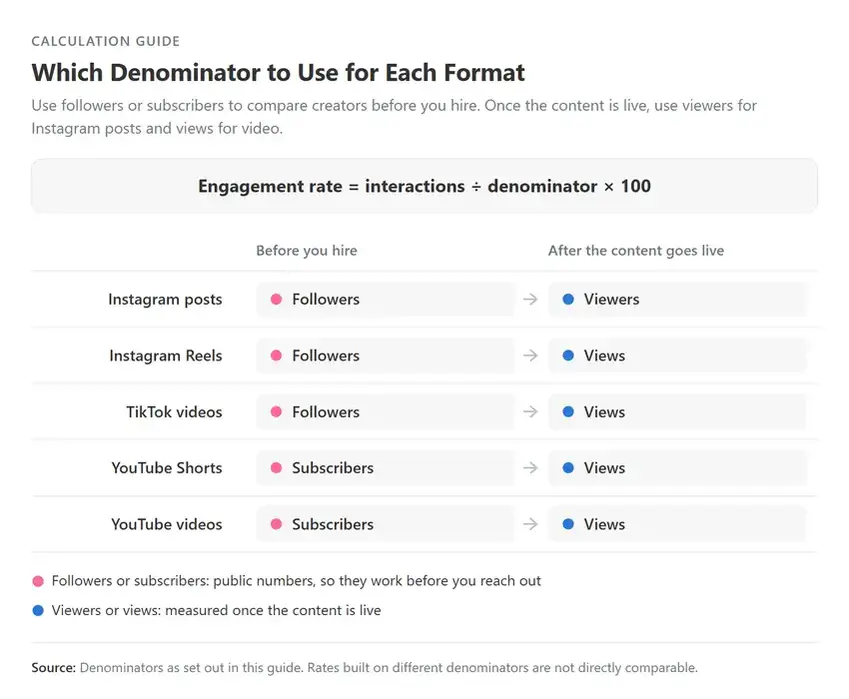
Which Denominator to Use for Each Format
Use followers or subscribers to compare creators before you hire. Once the content is live, use viewers for Instagram posts and views for video.
|
Format |
Before you hire |
After the content goes live |
|---|---|---|
|
Instagram posts |
Followers |
Viewers |
|
Instagram Reels |
Followers |
Views |
|
TikTok videos |
Followers |
Views |
|
YouTube Shorts |
Subscribers |
Views |
|
YouTube videos |
Subscribers |
Views |
On TikTok, a rate by followers and a rate by views for the same video can sit far apart. In 2020, TikTok said follower count was not a direct factor in its For You recommendations, so videos could reach people who do not follow the creator (TikTok Newsroom, 2020). Only compare rates built on the same denominator.

How to Judge a Creator's Engagement Rate
Judge a creator's engagement rate against peers measured the same way, against their own median and against their comments. Run these checks before you hire, and again when the content goes live.
Five Checks Before You Hire
Write the method and the by-followers benchmark for each platform into your campaign brief template, so each creator on the campaign is measured the same way.
1. Match the method and the format. Run the creator through our Instagram or TikTok calculator and compare the result with creators on the same platform, calculated the same way. Compare Reels with Reels, and hold a by-followers rate against other by-followers rates only.
2. Compare the creator with their own median. Sort the rates of 12 to 24 recent posts and take the middle one, called the median. One viral post can lift an average for months, while the median barely moves.
3. Read the comments. Specific replies, questions and tagged friends signal a real audience. Short generic praise repeated across posts is a warning sign.
4. Compare within size. Judge a creator with 8,000 followers against peers of similar size, and do the same for a creator with 400,000.
5. Check the direction. A rate that holds or rises across recent posts tells you more than one strong month.
Red Flags That Inflate Engagement
Look closer when you see any of these signs that a high rate may not come from a real audience.
• A rate far above peers of the same size, paired with thin or repetitive comments.
• A sudden jump in followers with no matching jump in views.
• Many likes, with comments and saves close to zero.
• Comments in languages or locations that do not match the creator's stated audience.
• One unusually strong post carrying the whole average, while the median stays flat.
Any one sign alone is inconclusive. Two or more together are worth a question before you hire.
Limits of This Data
Our three sources (the July 2026 marketplace snapshot, the 2026 report and the calculators' benchmarks) measure different things, so compare a creator with one source at a time. The 5.7% figure reflects verified creator profiles on July 23, 2026, with creators listed in more than one niche counted in each. The data does not say which platforms are included or which audience number the rate divides by, so do not use it as a benchmark for one platform or format.
The report's format figures do not say which audience number they divide by or which accounts they cover. Neither source splits engagement by account size, so the size pattern here comes from our Instagram calculator. Engagement measures audience response, so track sales with their own measures.

What This Means for Brands
A good engagement rate for your campaign clears peers on the same platform, format and calculation method, holds against the creator's own median and comes with real comments. The 1% to 3% range shows what is typical on Instagram by followers, and 5.7% shows what is typical for verified creators on Collabstr.
Engagement works alongside the influencer marketing key performance indicators (KPIs) that track brand awareness, referral traffic, conversions and return on investment (ROI). Check any account with our free calculators, then book creators on Collabstr, with prices shown before you hire and payment released when you approve the work.
FAQ
Is a 5% Engagement Rate Good?
It depends on the format and the method. Calculated by followers, 5% sits above the 1% to 3% range Collabstr's Instagram calculator calls average (Collabstr, 2026) and below the 17.5% average in Collabstr's TikTok calculator (Collabstr, 2026). Collabstr's 2026 report does not say how its format rates were calculated, so compare 5% only with peers on the same platform, format and method.
What Is a Good Engagement Rate on Instagram?
A good engagement rate on Instagram clears peers on the same method and format, and holds across recent posts. Collabstr's Instagram calculator calls 1% to 3% average by followers and puts the average Instagram influencer at 2.39% (Collabstr, 2026). Collabstr's 2026 Influencer Marketing Report lists Instagram posts at 3.5% and Reels at 5%, without saying how those were calculated (Collabstr, 2026).
What Is a Good Engagement Rate on TikTok?
A good TikTok engagement rate clears other TikTok creators measured on the same method. Collabstr's TikTok calculator, which divides likes and comments by followers, puts the average TikTok influencer at 17.5% (Collabstr, 2026). Collabstr's 2026 report lists TikTok videos at 2% without saying how that rate was calculated, so do not compare the two directly.
Methodology
• Verified engagement rate (5.7%): Collabstr production data, snapshot July 23, 2026. Average verified engagement rate for live marketplace creators (verified, public, active accounts) with an engagement rate on file, 84% of live creators. Computed for each niche, then averaged with each niche weighted by its number of creator accounts. Creators listed in more than one niche count once in each. The source does not specify which platforms are included or how the rate is calculated. Shown to one decimal place.
• Follower size shares (half under 10,000; 86% under 100,000): same snapshot, July 23, 2026. Each creator's best single platform, grouped by follower count (under 10,000; 10,000 to 100,000; 100,000 to 500,000; 500,000 and above). Profiles with no follower count excluded. Creators listed in more than one niche count once in each.
• Engagement by format and impressions rank: Collabstr 2026 Influencer Marketing Report, based on 2025 marketplace data, read September 14, 2026. The report does not state which audience number or which accounts its engagement rates are based on. Impressions ranks come from the report's separate list of top content by impressions.
• Instagram average range (1% to 3%) and 2.39% average: Collabstr Instagram engagement rate calculator, read September 14, 2026. Calculated by followers. The calculator's benchmark comes from its own account analysis, a separate dataset from the marketplace snapshot and the report.
• TikTok average (17.5%): Collabstr TikTok engagement rate calculator, read September 14, 2026. Calculated by followers. The calculator's benchmark comes from its own account analysis, a separate dataset from the marketplace snapshot and the report.
• Multiples: calculated by Collabstr from the figures above and rounded to one decimal place.
• Engagement rate: interactions divided by a denominator (followers, viewers or views), times 100. Figures from different denominators are not directly comparable.