How to Build Influencer Marketing Reporting for Content and Reach Collaborations
Key Takeaways
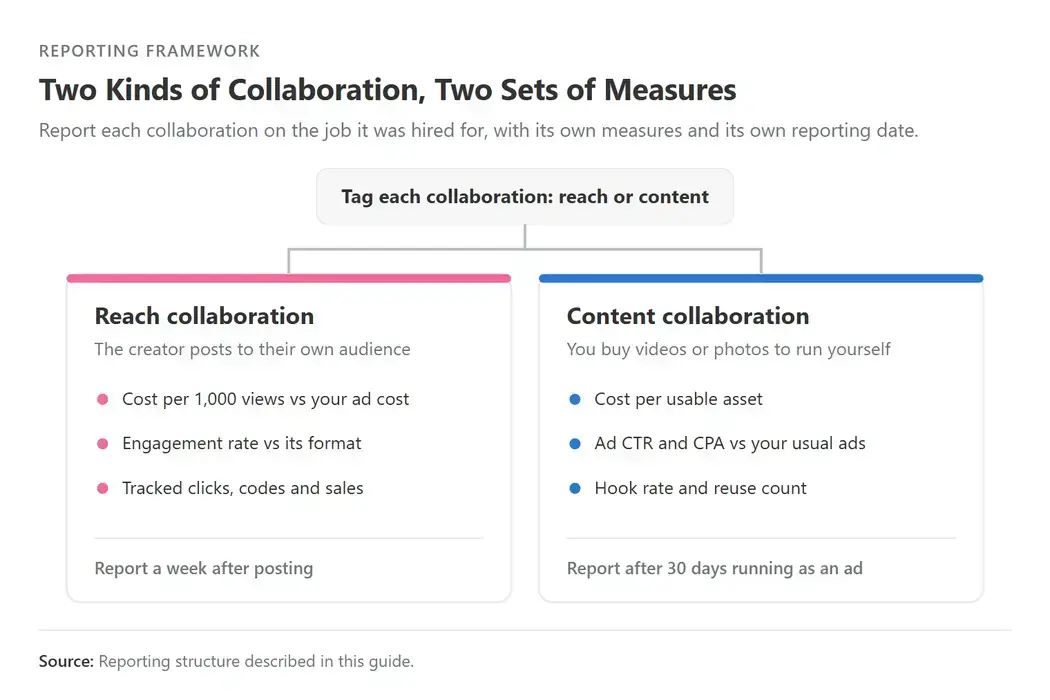
• Report each collaboration by the job it was hired for:
-
Reach collaborations, where the creator posts to their own audience, are measured on cost per 1,000 views, engagement and link clicks.
-
Content collaborations, where you buy videos or photos to run yourself, are measured on cost per usable asset, ad results and how many places you reuse each one.
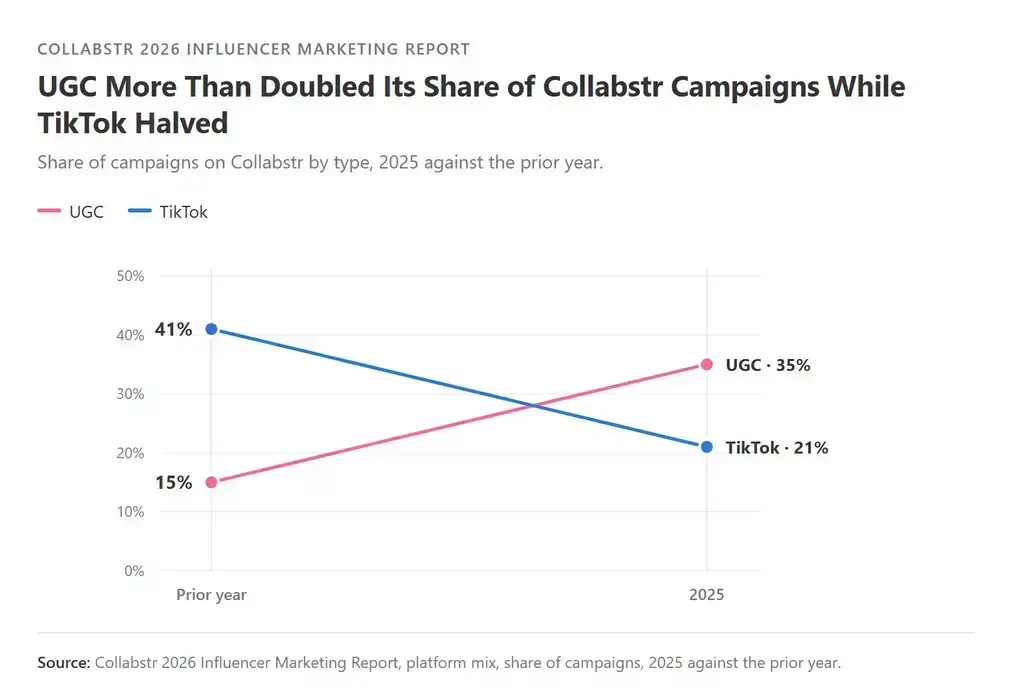
• Content work is growing. User-generated content (UGC), videos and photos creators make for a brand to post itself, rose from 15% to 35% of Collabstr campaigns in 2025 (Collabstr, 2026).
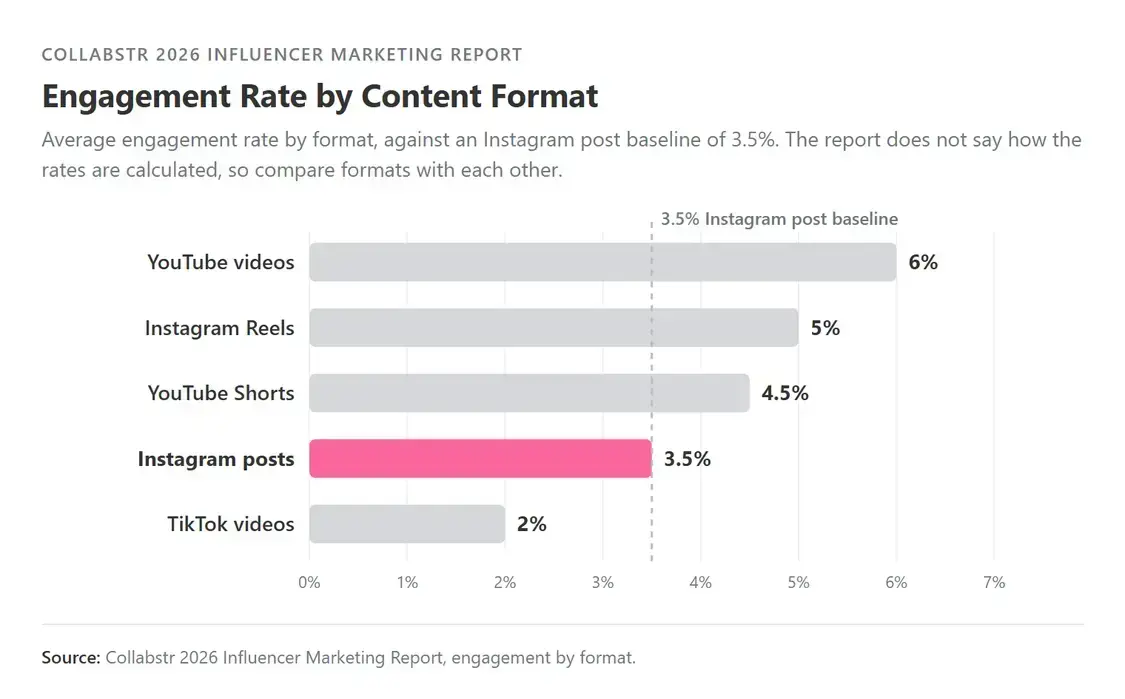
• Engagement rates differ by format, from 6% on YouTube videos to 2% on TikTok videos in Collabstr's 2026 report (Collabstr, 2026), so compare a post only with others in the same format.
• Put every result next to a comparison figure, such as your own ad costs, and show how many times higher or lower it is.
Influencer marketing reporting means measuring each creator collaboration against the job it was hired to do, so your team can decide which ones to repeat. Most collaborations do one of two jobs:
• Reach: the creator posts to their own audience, and you are paying for people to see it.
• Content: the creator makes videos or photos that you run yourself, as ads or on your own channels, and you are paying for the files.
This guide shows how to measure each type, then gives you a report template, key performance indicators (KPIs) for each goal and a reporting schedule.
Why Influencer Marketing Reporting Splits Reach From Content
The two types need different measures, and a quick example shows why. Both amounts are hypothetical.
• A reach collaboration: you pay a creator $250 for a post that earns 2,000 views. $250 ÷ 2,000 × 1,000 = $125, so you paid $125 for every 1,000 views.
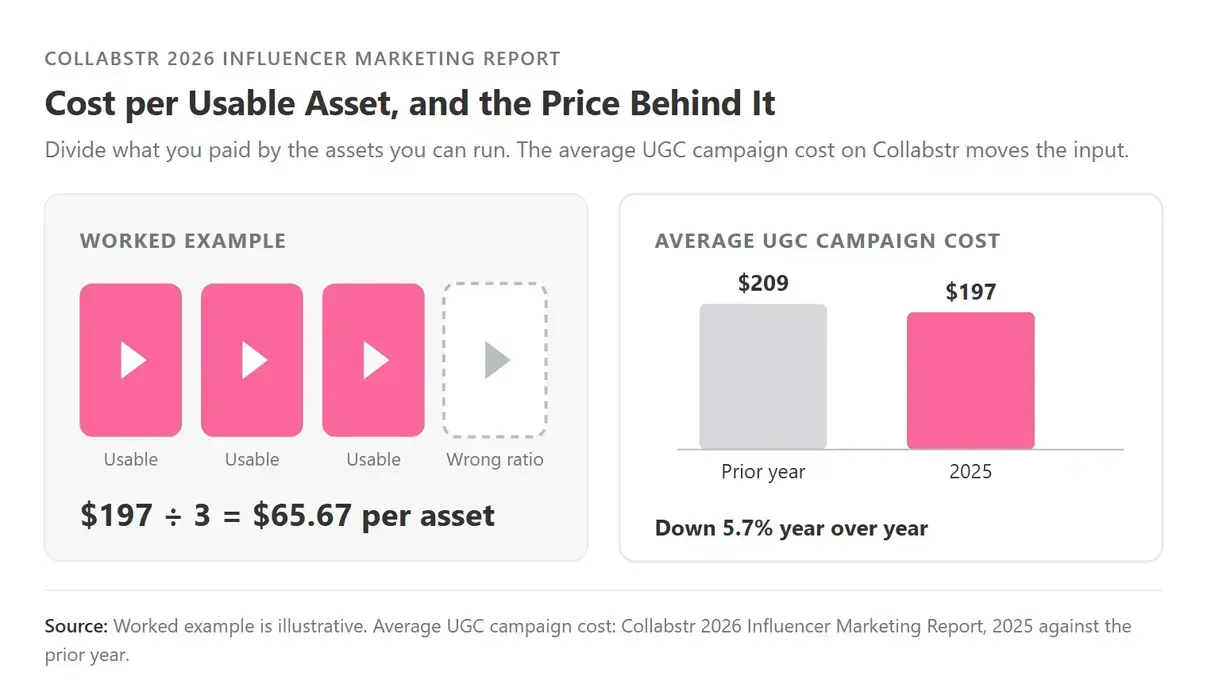
• A content collaboration: you pay $197 for UGC and get three videos you can use. $197 ÷ 3 = $65.67 for each usable video.
Judged on views, the content collaboration would score zero, because its videos run in your ads and on your own channels. Judged on cost per usable video, the report shows what you actually bought.
How the Campaign Mix Shifted in 2025
UGC more than doubled its share of Collabstr campaigns in 2025, from 15% to 35%, while TikTok fell from 41% to 21% (Collabstr, 2026). More than a third of campaigns now buy content.
|
Campaign type |
Share of campaigns, 2025 |
Share the year before |
|---|---|---|
|
|
40% |
Not reported |
|
UGC |
35% |
15% |
|
TikTok |
21% |
41% |
|
YouTube |
3% |
Not reported |
|
X (Twitter) |
1% |
Not reported |
|
Total |
100% |
Source: Collabstr 2026 Influencer Marketing Report, which gives year-before shares for UGC and TikTok only.
Each share is that type's slice of all campaigns on Collabstr in 2025, so the five add up to 100%. UGC's slice grew to 2.3 times its size the year before, and TikTok's shrank by about half. Instagram still held the largest slice.
Set Up Both Types in the Brief
Decide each collaboration's job in the brief, before you hire anyone. If the plan itself is still open, start with our influencer marketing strategy guide.
1. Tag each collaboration as reach or content. Reach covers awareness, traffic and sales. Content covers videos and photos you run yourself. Write the job into the campaign brief.
2. Agree the deliverable and the rights in writing. Content needs usage rights that match where it will run, so use the influencer contract template and our guide to content usage rights.
3. Build in tracking. Give reach creators a UTM-tagged link (a link with tracking codes, so your analytics can tell where visitors came from) or a unique discount code. Name content files so you can find them in your ad account.
4. Collect your comparison figures now. Pull your usual ad results: click-through rate (CTR), the share of people who click; cost per acquisition (CPA), what you pay for each sale; and what 1,000 video views cost you.
How to Report Reach Collaborations
Report reach collaborations on three measures: cost per 1,000 views, engagement rate for the format, and tracked clicks, code uses or sales. Show each one next to a comparison figure.
Cost per 1,000 Views, Against Your Own Ad Costs
Cost per 1,000 views is what you paid, divided by the views the post earned, times 1,000. In the example above, that came to $125.
Take the views from the post's own insights a week after it goes live, then compare the result with two figures: what 1,000 video views cost you in ads, and what you paid on earlier collaborations with creators of a similar size. If 1,000 video views cost you $100 in ads, this collaboration came in at 1.25 times that ($125 ÷ $100).
Use video views for both figures. Your ad account's cost per 1,000 impressions (CPM) counts every time an ad is shown, which is a bigger number than views.
Engagement Rate by Format
Engagement rate measures how much viewers interact with a post, such as liking, commenting or sharing. In Collabstr's 2026 Influencer Marketing Report, it ranges from 6% on YouTube videos to 2% on TikTok videos, a threefold spread (Collabstr, 2026), so compare each post only with others in the same format.
|
Format |
Engagement rate (2026 report) |
Compared with Instagram posts (3.5%) |
|---|---|---|
|
YouTube videos |
6% |
1.7x |
|
Instagram Reels |
5% |
1.4x |
|
YouTube Shorts |
4.5% |
1.3x |
|
Instagram posts |
3.5% |
1.0x |
|
TikTok videos |
2% |
0.6x |
1.7x means YouTube videos show 1.7 times the engagement rate of Instagram posts. The report names the interactions it counts but gives no formula, so use the table to see which formats tend to draw more engagement. Our Instagram engagement calculator and TikTok engagement calculator divide likes and comments by followers, which is a different measure, so use them to compare creators before you hire.
Clicks, Codes and Sales
If the job was traffic or sales, report visits from the tagged link, code uses and revenue, then what each click or sale cost you. Leave these blank if tracking was not set up.
To put a dollar value on the views themselves, add earned media value on its own line and name the CPM you used.
How to Report Content Collaborations
Report content collaborations on three measures: cost per usable asset, how each asset performs as an ad, and how many places you reuse it.
Cost per Usable Asset
Cost per usable asset is what you paid, divided by the videos or photos that passed your review and that you have the rights to use. In the example, $197 for three usable videos is $65.67 each. A fourth video in the wrong shape for your ads does not count.
Price changes move this number. In Collabstr's 2026 report, the average UGC campaign cost fell 5.7% year over year, from $209 to $197 (Collabstr, 2026), so when your cost per asset improves, check whether a lower price or better content drove it.
Ad Results Against Your Usual Ads
Once an asset runs as an ad, compare its results with your usual ads. Our guides to UGC ads and influencer whitelisting cover running creator content as ads. Report three numbers:
• Click-through rate, compared with your usual CTR
• Cost per acquisition, or return on ad spend (ROAS), the revenue each ad dollar brings back, compared with your usual figure
• Hook rate: the share of people shown the ad who watched at least three seconds
Reuse Count
Reuse count is the number of places an asset runs, such as paid social, a product page, email and your own posts. An asset used in five places spreads its cost across all five, which a views-only report misses.

An Influencer Marketing Report Template You Can Copy
This influencer marketing report template has seven sections and keeps reach and content results apart. Use one report per campaign. The appendix includes a disclosure check against the FTC's guidance for influencers (FTC, 2019).
If you track creators in our influencer marketing spreadsheet, its Results tab supplies the cost per 1,000 views and engagement figures for section 3.
|
Section |
What goes in it |
Type |
|---|---|---|
|
1. One-line summary |
Goal, spend, main result against target, recommendation |
Both |
|
2. Jobs and spend |
Each collaboration tagged reach or content, spend for each type |
Both |
|
3. Reach results |
Cost per 1,000 views against your ad cost for 1,000 video views, engagement against the format rate, clicks, codes, revenue where tracked |
Reach |
|
4. Content results |
Cost per usable asset, ad CTR and CPA against your usual ads, hook rate, reuse count |
Content |
|
5. Creator notes |
Delivery against the brief, revisions needed, fit for the next campaign |
Both |
|
6. Learnings |
What worked, what did not, the one test to run next |
Both |
|
7. Appendix |
Post links, screenshots of post insights, FTC disclosure check |
Both |
Which KPIs to Report for Each Goal
Each goal gets one main KPI: cost per 1,000 views for awareness, cost per click for traffic, cost per acquisition for sales, cost per usable asset for ad content and reuse count for content on your own channels.
|
Goal |
Type |
Main KPI |
Supporting KPIs |
|---|---|---|---|
|
Awareness |
Reach |
Cost per 1,000 views |
Views, engagement rate against the format rate |
|
Traffic |
Reach |
Cost per click |
Link visits, engagement rate |
|
Sales |
Reach |
Cost per acquisition |
Code uses, revenue, conversion rate |
|
Ad content |
Content |
Cost per usable asset |
Ad CTR and CPA against your usual ads, hook rate |
|
Content for your own channels |
Content |
Reuse count |
Cost per usable asset, places it runs |
Return on investment (ROI) sits on top when revenue is tracked. We cover it in influencer marketing ROI and tracking influencer ROI, with the wider metric list in influencer marketing KPIs.
Common Influencer Reporting Mistakes
Four mistakes make a report misleading:
• Judging content collaborations on views. Content earns its results in your ads and on your own channels.
• Averaging reach and content together. A low-cost UGC video and a higher-cost reach post average into a number that describes neither.
• Comparing engagement across formats. YouTube videos show three times the engagement rate of TikTok videos in the report (Collabstr, 2026), which it attributes to viewers of longer content being more invested.
• Reporting too early. Content needs time running as an ad before it has results.
When to Report, and How to Present It to Leadership
Report the two types on different schedules. Reach results are ready once posts have had a week to collect views, and content results after 30 days of running as ads. Leadership gets a one-page summary.
Reporting Schedule
• Weekly, while posts are live: a quick internal check on delivery and early views.
• A week after posting: finish the reach report, and record cost per usable asset for content.
• After 30 days of ad spend: report content's ad results and reuse count.
• Every quarter: add up campaigns by type and compare them with the quarter before.
Presenting Results to Leadership
Open with one page: one headline number for reach and one for content, each shown against its comparison figure, for example "1.25 times our ad cost per 1,000 views". Use the ad terms leadership already knows, such as CTR and CPA, and end with a recommendation on what to repeat.
What This Means for Brands
When you report each collaboration on the job it was hired for, you can see which ones to repeat. Tag the job in the brief, report reach and content separately, and put every number next to a comparison figure.
Collabstr keeps the brief, the hire, the payment and the delivered content in one place. You can compare our pricing or check average creator rates by platform, category and follower count with the influencer price calculator.
FAQ
What Is the Difference Between Reach and Content Collaborations?
A reach collaboration pays a creator to post to their own audience, so you measure views, engagement and clicks. A content collaboration pays a creator for videos or photos you run yourself, so you measure cost per usable asset, ad results and reuse.
How Do You Measure UGC Performance?
Measure UGC on cost per usable asset: what you paid, divided by the videos or photos you can use. Once an asset runs as an ad, compare its click-through rate and cost per acquisition with your usual ads, then count how many places you reuse it.
How Often Should You Report on Influencer Marketing?
Check in weekly while posts are live. Finish reach reports a week after posting, and content reports after 30 days of running as ads. Add everything up by type each quarter.
What Is a Good Cost per 1,000 Views for an Influencer Collaboration?
Compare it with what 1,000 video views cost you in your own ads, and with earlier collaborations with creators of a similar size. Work it out from the views the post actually earned.
What Is a Good Engagement Rate for Influencer Content?
It depends on the format. Collabstr's 2026 Influencer Marketing Report lists 6% for YouTube videos, 5% for Instagram Reels, 4.5% for YouTube Shorts, 3.5% for Instagram posts and 2% for TikTok videos (Collabstr, 2026). The report gives no formula, so compare posts within one format, and treat an engagement calculator's followers-based rate as a different measure.
Methodology
• Platform mix, engagement by format and UGC campaign cost: Collabstr 2026 Influencer Marketing Report (Collabstr, 2026). Campaign shares are shares of campaigns by platform or type, 2025 against the prior year. The report names the interactions it counts in engagement but gives no formula. The multiples are our calculation from the published figures.
• Disclosure guidance: Federal Trade Commission, Disclosures 101 for Social Media Influencers (November 2019).
• Worked examples ($250 at 2,000 views; $197 for three videos; a $100 ad cost per 1,000 video views) are hypothetical illustrations of the formulas.