Build Your Influencer Marketing Spreadsheet Around the Hire
If you are tracking creators in a spreadsheet, this guide gives you the tab structure, the formulas and the dropdown values to copy.
Key Takeaways
• A tracking sheet earns its place when it answers three questions without a search through messages: who did we hire, what did we pay, and what did the content do.
• Build it around the hire. Creators get booked two ways, from a campaign you post and straight from a creator's profile, and a sheet with one row per campaign has nowhere to put the second kind.
• Make the deliverable a required field. Without it you cannot compare what a Reel costs against a Story, or work out cost per asset.
Once you run more than a couple of creators, you need one place to record what each cost, what they delivered and how it performed. A tracking spreadsheet does that in one file: what a Reel cost, which creator is late, how much you spent last quarter, and who is worth hiring again.
That structure matters because of how hires actually start. Some come from a campaign you posted and creators applied to. Others are a package you bought straight from a creator's profile, with no campaign behind them at all. A sheet built around campaigns has nowhere to file the second kind, and if nobody writes down what the creator made, you cannot say later what you paid for.
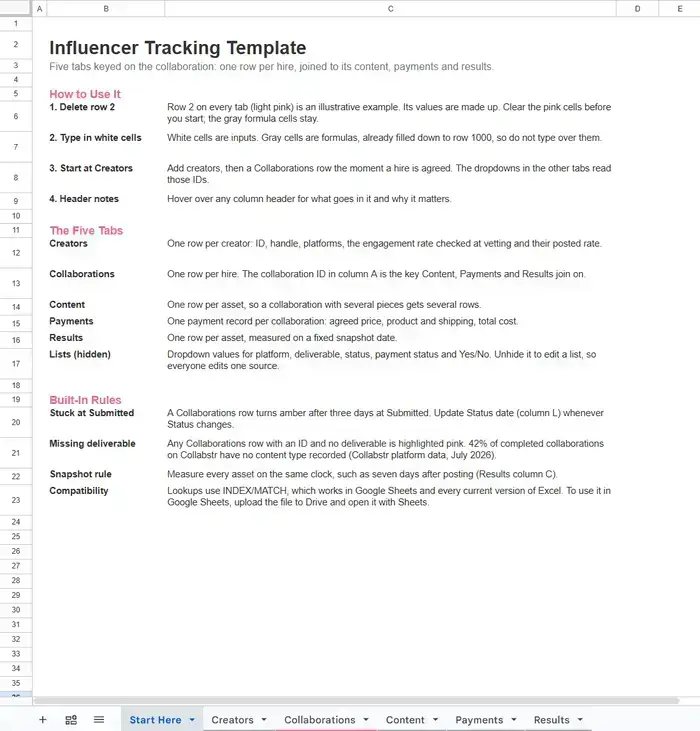
Below is that sheet: five tabs, working formulas and dropdown values drawn from what brands hire creators to make. The column letters match the formulas, so it copies straight into Google Sheets or Excel.
One Hire, Start to Finish
Here is one hypothetical hire, tracked through the sheet:
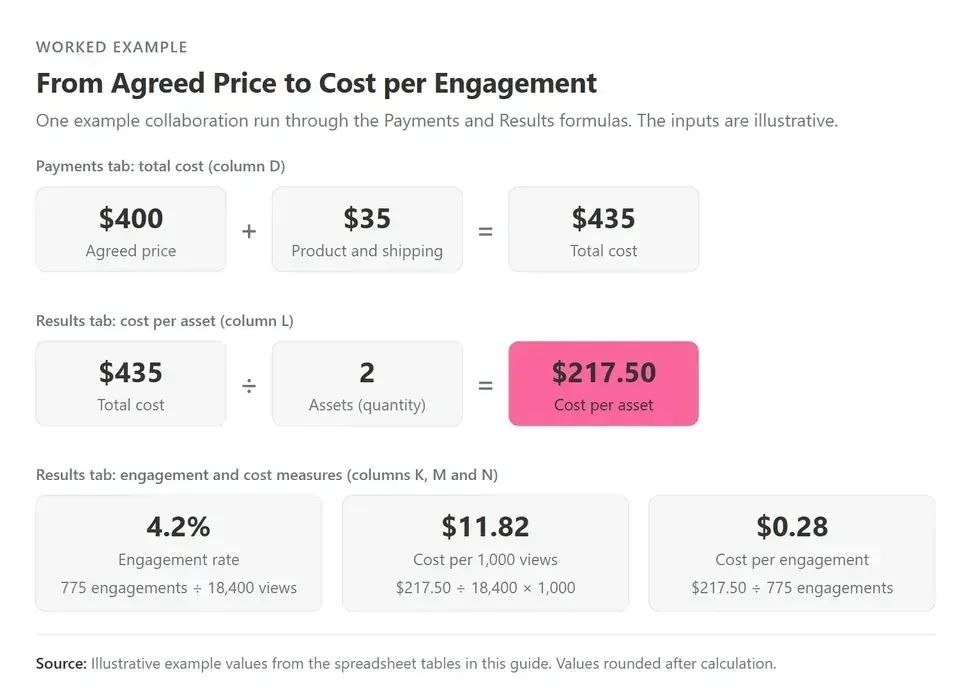
1. The hire. You hire @maya.moves for two Reels at $400. Shipping the product costs $35, so the hire costs $435, or $217.50 per Reel.
2. The results. Reel one gets 18,400 views and 775 likes, comments, shares and saves.
3. The answers. 775 ÷ 18,400 is a 4.2% engagement rate, $217.50 ÷ 18,400 × 1,000 is $11.82 per 1,000 views, and $217.50 ÷ 775 is $0.28 per engagement.
How to Structure an Influencer Tracking Spreadsheet
Structure an influencer tracking spreadsheet around the hire. Each hire gets its own ID and row, the campaign becomes an ordinary column, and the deliverable becomes a dropdown with fixed values.
Give Each Hire Its Own Row
Each row is one hire, with its own identification number (ID) created the moment the hire is agreed, typed on every other tab so a payment or a post traces back to it. Create the row when the hire is agreed, then work through our influencer onboarding checklist from there. Campaign becomes an ordinary column, with "No campaign" as a valid value.
A hire booked straight from a creator's profile still has a cost and a deliverable. In a tracker built around campaigns it ends up under "misc", or nowhere, and your quarterly spend stops matching your payments. Giving each hire its own row keeps every cost attached to the creator who earned it, so you can close a quarter from the sheet instead of rebuilding it from messages. Keying on the hire does three more things:
• Spend has a row. Every payment points to a hire, so your spend adds up however the hire started.
• Content stays tidy. One hire can produce several assets without retyping creator details.
• Results add up any way you need. Total by campaign, creator, platform or deliverable, because each is a column.
Build the Deliverable Dropdown From What Brands Hire
The deliverable dropdown should list the formats brands hire most. Video and Reels rank in the top five deliverables in all 26 niches, or content categories, in Collabstr's data. Stories rank there in 96% of niches and video ads in 92% (Collabstr platform data, July 2026).
A fixed list stops "reel", "IG Reel" (short for Instagram Reel) and "Instagram reels video" from splitting one format into three totals.
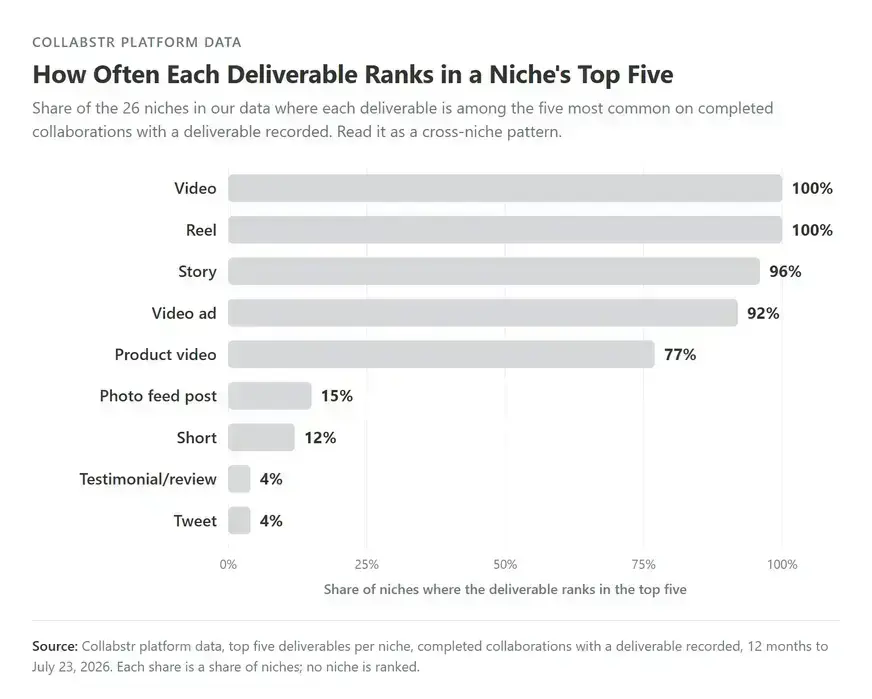
This ranking uses only hires with a recorded deliverable. In 2025, the most requested formats were Instagram Reels, Instagram posts, TikTok videos, YouTube Shorts and YouTube videos (Collabstr, 2026). Combine the two for your dropdown: Video, Reel, Story, Video ad, Product video, Instagram post, TikTok video, YouTube Short, YouTube video, Photo feed post, Other.
The Influencer Marketing Spreadsheet, Tab by Tab
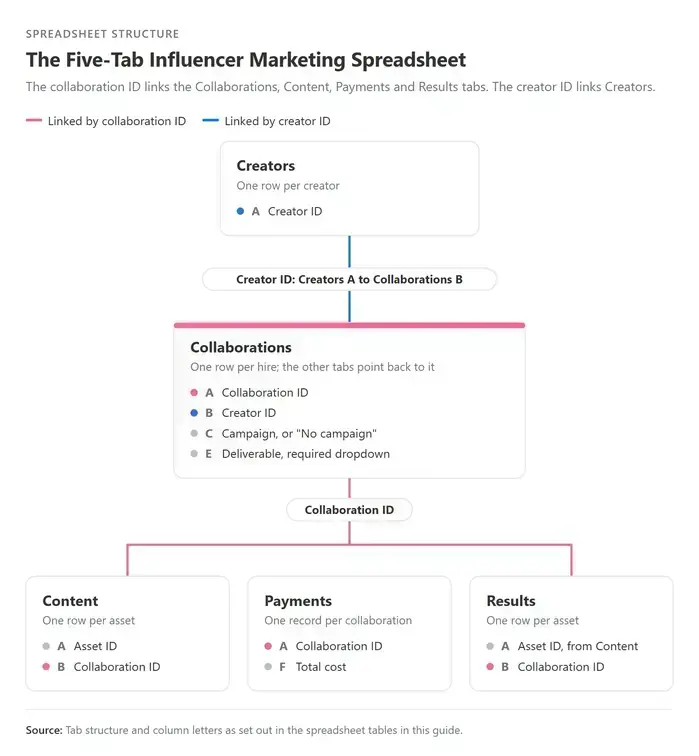
The influencer marketing spreadsheet has five tabs, each with one job: Creators, Collaborations, Content, Payments and Results. The formulas use the column letters below.
Creators Tab
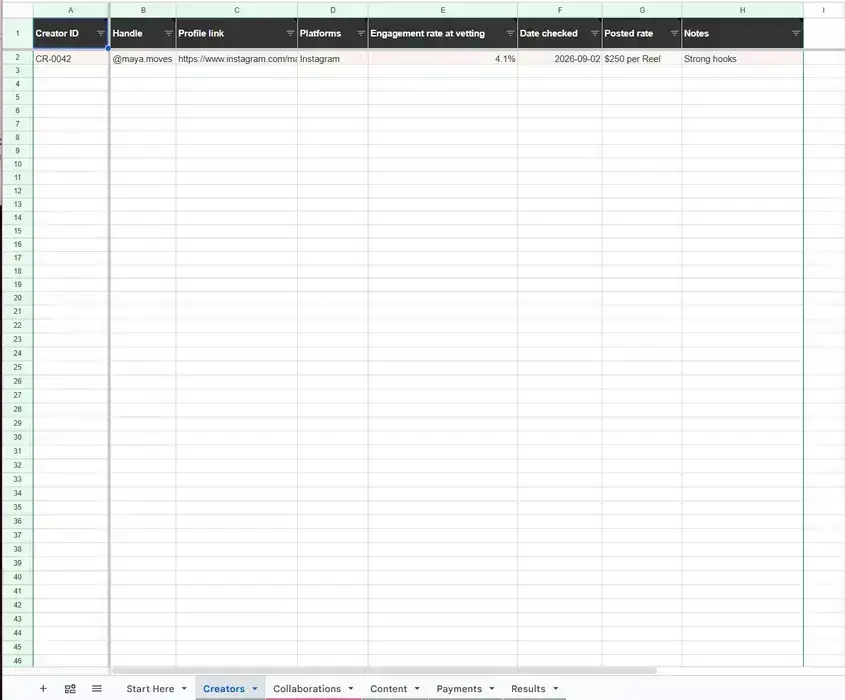
The Creators tab holds one row per creator: ID, handle, platforms, the engagement rate checked at vetting and their posted rate.
|
Col |
Column |
What goes in it |
Example |
Why it matters |
|---|---|---|---|---|
|
A |
Creator ID |
Short unique code |
CR-0042 |
IDs stay fixed when handles change |
|
B |
Handle |
Primary handle |
@maya.moves |
How the team refers to them |
|
C |
Profile link |
URL |
Profile URL |
One click to verify the account |
|
D |
Platforms |
Dropdown, multiple selections (Google Sheets) |
|
Filters for the next brief |
|
E |
Engagement rate at vetting |
Profile rate when you checked |
4.1% |
Records the rate on the day you checked |
|
F |
Date checked |
Date |
2026-09-02 |
Dates the snapshot |
|
G |
Posted rate |
Listed price for your main deliverable |
$250 per Reel |
Your reference before you hire |
|
H |
Notes |
Fit, tone, feedback |
Strong hooks |
Context the next teammate needs |
Example row, Creators
|
A Creator ID |
B Handle |
C Profile link |
D Platforms |
E Engagement rate |
F Date checked |
G Posted rate |
H Notes |
|---|---|---|---|---|---|---|---|
|
CR-0042 |
@maya.moves |
Profile URL |
|
4.1% |
2026-09-02 |
$250 per Reel |
Strong hooks |
Collaborations Tab
The Collaborations tab holds one row per hire, and the Content, Payments and Results tabs all point back to it. It records the creator, campaign, deliverable, price and status for each hire.
|
Col |
Column |
What goes in it |
Example |
Why it matters |
|---|---|---|---|---|
|
A |
Collaboration ID |
Unique code, created at hire |
C-2026-118 |
The ID the other tabs use to find the hire |
|
B |
Creator ID |
Dropdown from Creators A |
CR-0042 |
No retyping creator details |
|
C |
Campaign |
Name or "No campaign" |
No campaign |
Unlinked collaborations still get a row |
|
D |
Platform |
Dropdown |
|
Rolls results up by channel |
|
E |
Deliverable |
Dropdown, required |
Reel |
Required, so every hire records what you bought |
|
F |
Quantity |
Number of assets |
2 |
Needed for cost per asset |
|
G |
Agreed price |
What you agreed to pay the creator |
$400 |
Base of every cost formula |
|
H |
Brief link |
URL |
Brief doc |
Settles scope questions |
|
I |
Contract link |
URL |
Signed contract |
Settles scope questions |
|
J |
Usage rights |
Where and how long you may reuse content |
Paid social, 90 days |
Stops content running past its license |
|
K |
Status |
Offer sent, Hired, In production, Submitted, Approved, Paid |
Paid |
One filter shows what is stuck |
|
L |
Status date |
Date Status last changed |
2026-09-12 |
Shows how long a row has waited |
Example row, Collaborations (columns A to F)
|
A Collaboration ID |
B Creator ID |
C Campaign |
D Platform |
E Deliverable |
F Quantity |
|---|---|---|---|---|---|
|
C-2026-118 |
CR-0042 |
No campaign |
|
Reel |
2 |
Example row, Collaborations (columns G to L)
|
G Agreed price |
H Brief link |
I Contract link |
J Usage rights |
K Status |
L Status date |
|---|---|---|---|---|---|
|
$400 |
Brief doc |
Signed contract |
Paid social, 90 days |
Paid |
2026-09-12 |
Fill the link columns with our campaign brief template and contract template.
Content Tab
The Content tab holds one row per asset, so a collaboration with several pieces gets several rows. It tracks approvals, the live web address (URL), the disclosure check and the raw file.
|
Col |
Column |
What goes in it |
Example |
Why it matters |
|---|---|---|---|---|
|
A |
Asset ID |
One row per piece of content |
C-2026-118-A |
One collaboration, several assets |
|
B |
Collaboration ID |
Dropdown from Collaborations A |
C-2026-118 |
Joins back to price and creator |
|
C |
Submitted date |
Date |
2026-09-10 |
Starts the approval clock |
|
D |
Approved date |
Date |
2026-09-12 |
Stops the approval clock |
|
E |
Days to approval |
Formula |
2 |
Shows where approvals stall |
|
F |
Live URL |
URL |
instagram.com/reel/... |
Proof of delivery |
|
G |
Posted date |
Date |
2026-09-13 |
Sets the results snapshot |
|
H |
Disclosure checked |
Yes or No |
Yes |
Confirms the post follows FTC disclosure guidance |
|
I |
Raw file location |
Folder link |
Assets / Sept |
Keeps the source file ready for reuse |
Example row, Content
|
A Asset ID |
B Collaboration ID |
C Submitted |
D Approved |
E Days to approval |
F Live URL |
G Posted |
H Disclosure |
I Raw file |
|---|---|---|---|---|---|---|---|---|
|
C-2026-118-A |
C-2026-118 |
2026-09-10 |
2026-09-12 |
2 |
instagram.com/reel/... |
2026-09-13 |
Yes |
Assets / Sept |
Column H records whether each post follows Federal Trade Commission (FTC) disclosure guidance for influencers (FTC, 2019). Check it before the results snapshot, while the post is new and easy to edit.
Payments Tab
The Payments tab holds one payment record per collaboration and adds the agreed price and product and shipping into total cost.
|
Col |
Column |
What goes in it |
Example |
Why it matters |
|---|---|---|---|---|
|
A |
Collaboration ID |
Dropdown from Collaborations A |
C-2026-118 |
One payment record per collaboration |
|
B |
Agreed price |
Formula (lookup) |
$400 |
Copies the price, so you type it once |
|
C |
Product and shipping |
Cost of goods sent |
$35 |
Part of the true cost |
|
D |
Total cost |
Formula |
$435 |
What every result divides by |
|
E |
Payment status |
Not funded, Funded, Released |
Released |
Shows what is owed |
Example row, Payments
|
A Collaboration ID |
B Agreed price |
C Product and shipping |
D Total cost |
E Payment status |
|---|---|---|---|---|
|
C-2026-118 |
$400 |
$35 |
$435 |
Released |
Results Tab
The Results tab holds one row per asset, measured on a fixed snapshot date. It turns views and engagement into engagement rate and three cost measures. Those columns feed straight into an influencer marketing report.
|
Col |
Column |
What goes in it |
Example |
Why it matters |
|---|---|---|---|---|
|
A |
Asset ID |
Dropdown from Content A |
C-2026-118-A |
Results belong to the asset |
|
B |
Collaboration ID |
Formula (lookup) |
C-2026-118 |
Links results to cost |
|
C |
Snapshot date |
Posted date plus seven days |
2026-09-20 |
Same clock for every asset |
|
D |
Views |
From creator insights |
18,400 |
Base for cost per 1,000 views |
|
E |
Likes |
Number |
610 |
Engagement input |
|
F |
Comments |
Number |
42 |
Engagement input |
|
G |
Shares |
Number |
35 |
Engagement input |
|
H |
Saves |
Number |
88 |
Engagement input |
|
I |
Link clicks |
If tracked |
120 |
Closer to revenue than views |
|
J |
Code uses |
If tracked |
Blank |
Closer to revenue than views |
|
K |
Engagement rate |
Formula |
4.2% |
Compares creators fairly |
|
L |
Cost per asset |
Formula |
$217.50 |
Splits cost across assets |
|
M |
Cost per 1,000 views |
Formula |
$11.82 |
Compares reach across formats |
|
N |
Cost per engagement |
Formula |
$0.28 |
Compares response across formats |
Example row, Results (what you enter)
|
A Asset ID |
C Snapshot date |
D Views |
E Likes |
F Comments |
G Shares |
H Saves |
I Link clicks |
|---|---|---|---|---|---|---|---|
|
C-2026-118-A |
2026-09-20 |
18,400 |
610 |
42 |
35 |
88 |
120 |
Example row, Results (what the sheet works out)
|
K Engagement rate |
L Cost per asset |
M Cost per 1,000 views |
N Cost per engagement |
|---|---|---|---|
|
4.2% |
$217.50 |
$11.82 |
$0.28 |
Formulas and Setup in Google Sheets or Excel
The Formulas That Turn Rows Into Answers
Write each formula once in row 2 of its column and fill down. XLOOKUP works in Google Sheets and Excel 365, and Excel 2016 and 2019 lack it, so each lookup also has an INDEX/MATCH version. Use the INDEX/MATCH version throughout, so the sheet works the same way in Google Sheets and in every version of Excel.
Payments Tab
• B, Agreed price: =XLOOKUP(A2,Collaborations!A:A,Collaborations!G:G,""). Older Excel: =IFERROR(INDEX(Collaborations!G:G,MATCH(A2,Collaborations!A:A,0)),"")
• D, Total cost = agreed price + product and shipping: =IFERROR(B2+C2,""). Example: $400 + $35 = $435.
Content Tab
• E, Days to approval: =IF(OR(C2="",D2=""),"",D2-C2), formatted as a number. Example: 2.
Results Tab
• B, Collaboration ID: =XLOOKUP(A2,Content!A:A,Content!B:B,""). Older Excel: =IFERROR(INDEX(Content!B:B,MATCH(A2,Content!A:A,0)),"")
• K, Engagement rate = (likes + comments + shares + saves) / views: =IFERROR((E2+F2+G2+H2)/D2,""), formatted as a percent. Example: 775 / 18,400 = 4.2%.
• L, Cost per asset = total cost / quantity: =IFERROR(XLOOKUP(B2,Payments!A:A,Payments!D:D)/XLOOKUP(B2,Collaborations!A:A,Collaborations!F:F),""). Older Excel: =IFERROR(INDEX(Payments!D:D,MATCH(B2,Payments!A:A,0))/INDEX(Collaborations!F:F,MATCH(B2,Collaborations!A:A,0)),""). Example: $435 / 2 = $217.50.
• M, Cost per 1,000 views: =IFERROR(L2/D2*1000,""). Example: $217.50 / 18,400 × 1,000 = $11.82.
• N, Cost per engagement: =IFERROR(L2/(E2+F2+G2+H2),""). Example: $217.50 / 775 = $0.28.
Column L splits cost evenly across a collaboration's assets. If assets were priced differently, type the per-asset cost into L instead.
Check engagement before you hire with the Instagram engagement calculator or TikTok engagement calculator, and compare posted rates in the influencer price calculator. To turn results into a return figure, see our guide to influencer marketing return on investment (ROI).
Setup Steps
1. Create the five tabs with the exact tab names above and freeze each header row.
2. Add dropdowns with data validation. Keep the lists on a hidden "Lists" tab so everyone edits one source. Multiple selections in one dropdown (Creators D) are a Google Sheets option; in Excel, add one Yes/No column per platform after column H.
3. Copy values across with lookups so the price and quantity are typed once, on Collaborations, and the other tabs read them from there.
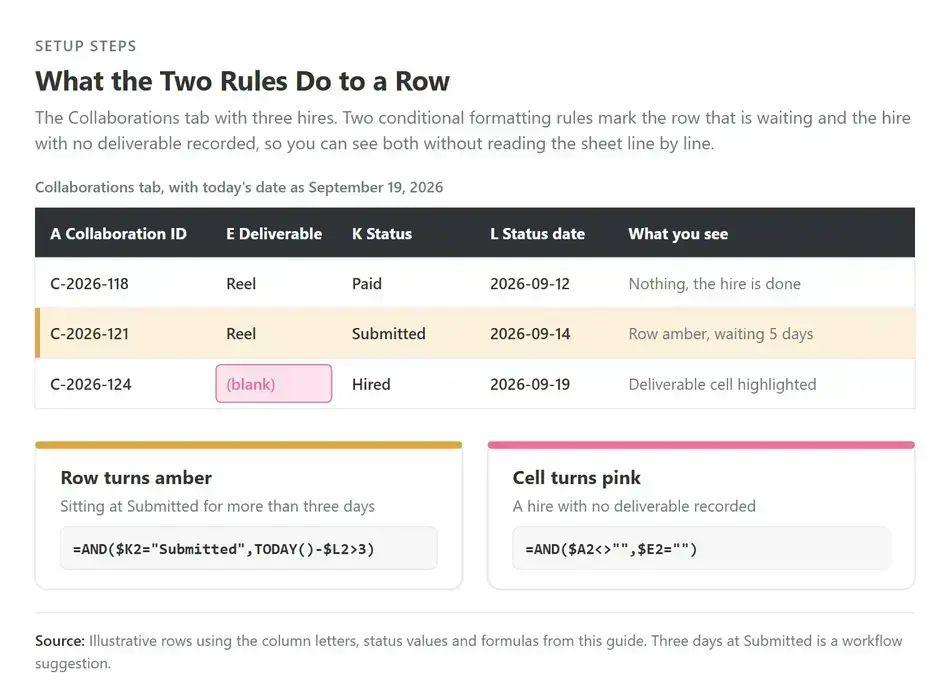
4. Make the sheet flag what is stuck. Update the status date in Collaborations L whenever the status changes. Then add a conditional formatting rule over A2:L (in Excel, A2:L1000) using the formula =AND($K2="Submitted",TODAY()-$L2>3). Any row that has sat at Submitted for more than three days turns amber.
5. Make the deliverable required. A second rule on Collaborations, =AND($A2<>"",$E2=""), highlights any row that has an ID but no deliverable, so nothing reaches the Results tab without one.
6. Fix one snapshot rule for results, such as seven days after posting.
7. Give each tab one owner.
When a Spreadsheet Stops Working
A spreadsheet stops working when volume, payments, approvals or content files outgrow it. These are the four strain points:
• Volume. As more collaborations run at once, status columns fall behind the work.
• Payments. A sheet records that a payment is due. Holding funds until the work is approved takes a payment system.
• Approvals. Drafts arrive by email, direct message (DM) and shared drive, and the sheet only knows the ones someone logged.
• Content files. Links expire and raw files sit in personal folders the sheet cannot protect.
On Collabstr, the hire, the deliverable, content approval and payment sit in one place, and payment is released when you approve the work. Our guide to influencer marketing automation covers which of those steps to move off the sheet first.

What This Means for Brands
Build the sheet around the hire and it answers the questions a brand gets asked: what we spent, on whom, and what came back. One row per hire keeps every cost attached to a creator, a required deliverable column keeps those costs comparable, and the formulas turn the rows into cost per asset, cost per 1,000 views and cost per engagement.
Copy the column layout above into a blank workbook, starting with the five tab names and the header row on each one. When the sheet lags behind the work, see how pricing works on Collabstr. For what to measure next, read our guide to influencer marketing key performance indicators (KPIs).
Our influencer marketing measurement guide shows which metric to pick for each goal.
FAQ
What Should an Influencer Tracking Spreadsheet Include?
Five tabs: Creators, Collaborations, Content, Payments and Results, with the collaboration ID typed on each one so every row traces back to its hire. Make the deliverable a required dropdown, so every hire records what you bought, and give collaborations with no campaign their own rows.
How Do I Calculate Engagement Rate in a Spreadsheet?
Add likes, comments, shares and saves, then divide by views. With views in column D and those counts in columns E to H, the formula is =IFERROR((E2+F2+G2+H2)/D2,""), formatted as a percent. Some teams divide by followers instead, which suits feed posts. Pick one method and read each asset the same number of days after posting.
When Should You Move From a Spreadsheet to an Influencer Platform?
Move when the sheet stops matching the work: status columns lag, approvals scatter across email and DMs, payments are tracked by hand and content files sit in personal folders. A platform that holds the hire, approval and payment in one place records each step as it happens.
Methodology
• Collabstr platform data: production data generated July 23, 2026, covering collaborations completed in the 12 months to that date. Internal and test accounts are excluded.
• Deliverables: the five most common deliverables on completed collaborations with a deliverable recorded, in each of 26 niches (content categories). The chart shows the share of niches in which each deliverable appears in the top five. Each share is a share of niches, and no niche is ranked.
• Collabstr 2026 Influencer Marketing Report: published report covering 2025, used for the most requested content formats.
• Platform scale: brand and creator figures as shown on collabstr.com at publish.
• Engagement rates, prices, view counts and dates in the spreadsheet examples are illustrative.