Influencer Marketing Measurement Starts With Choosing the Metric
If you are a brand, this guide shows how to pick the metric you will judge creators on, and what to measure at each stage of a campaign. If you are a creator, it shows what brands will be measuring your posts against.
Key Takeaways
• The metric you use to compare creators changes who looks best, so decide it from your campaign goal before you look at profiles.
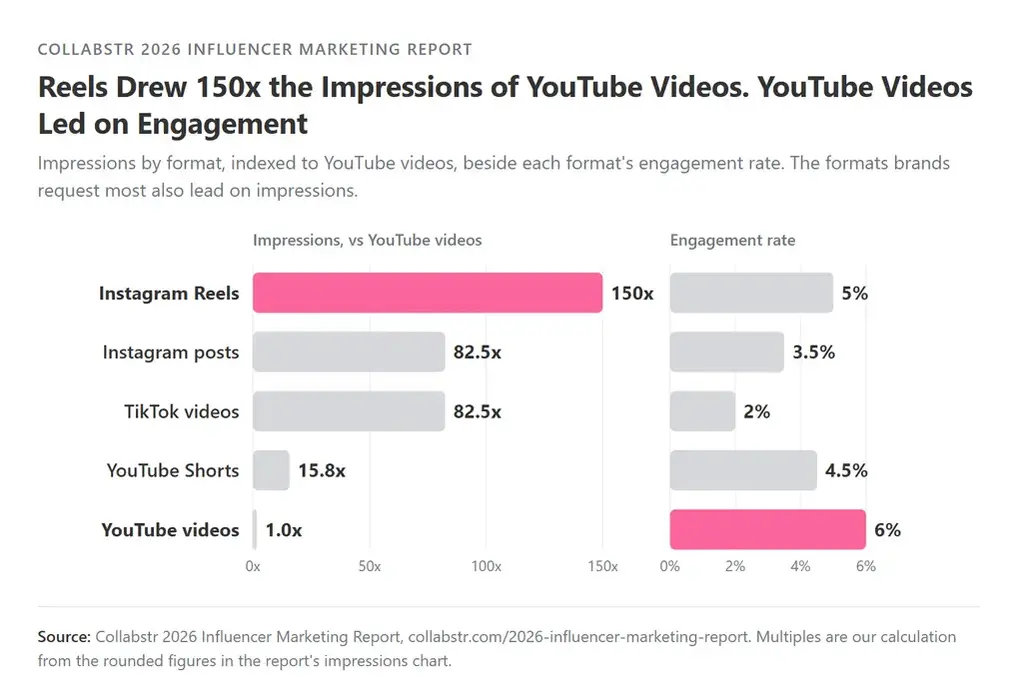
• In Collabstr's 2026 Influencer Marketing Report, Instagram Reels drew 150 times the impressions of YouTube videos, yet YouTube videos had the higher engagement rate, a measure of how much viewers interact, at 6% against 5% (Collabstr, 2026).
• Measure in four stages: before hiring, during delivery, after posting, and business results such as sales. Set up tagged links, codes and a report template before the first post goes live.
• Set up tagged links, codes and a report template before the first post goes live.
Judged on cost per view, Creator A wins. Judged on engagement, Creator B wins. Both answers are right for the metric that produced them. For the return calculation, see our guide to influencer marketing return on investment (ROI).
Impressions and Engagement Pick Different Formats
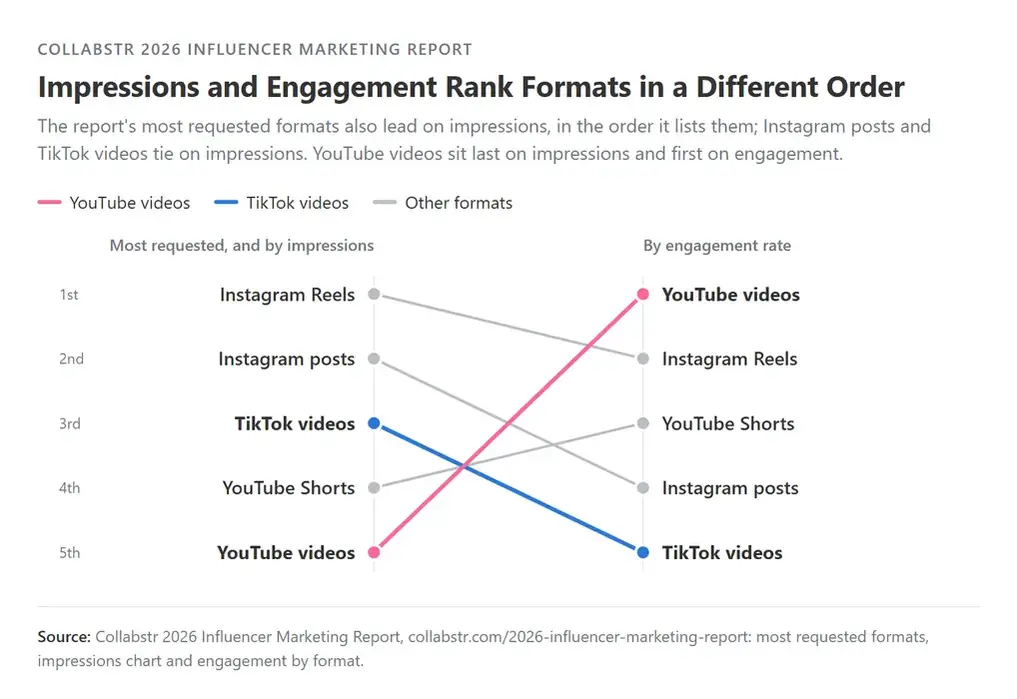
The same split runs through Collabstr's 2026 report, where one format reaches the most people and a different one draws the most interaction. Instagram Reels drew the most impressions, the number of times content was shown, followed by Instagram posts and TikTok videos, tied. Long-form YouTube videos led on engagement.
The report's impressions chart gives one figure per format. The table below shows each format's impressions as a multiple of the YouTube videos figure, so 82.5x means 82.5 times as many impressions as YouTube videos:
|
Format |
Impressions, vs YouTube videos |
Engagement rate |
|---|---|---|
|
Instagram Reels |
150x |
5% |
|
Instagram posts |
82.5x |
3.5% |
|
TikTok videos |
82.5x |
2% |
|
YouTube Shorts |
15.8x |
4.5% |
|
YouTube videos |
1.0x |
6% |
Source: Collabstr 2026 Influencer Marketing Report. Multiples are our calculation from the rounded figures in the report's impressions chart.
At that scale, each figure must add up many posts, so a format brands use more often collects more impressions. The report also lists the same formats first on brand requests and on impressions.
YouTube videos were shown the least, but viewers interacted with them the most: the format drew the fewest impressions and the highest engagement rate. TikTok videos matched Instagram posts on impressions but had the lowest rate, at 2%. The report attributes YouTube's lead to viewers who choose longer content being more invested.
How to Use These Figures
Pick the format from the job the campaign has to do, then judge individual creators on their own delivered numbers.
If the job is to be seen by as many people as possible, start from Reels and Instagram posts, and measure the campaign on impressions and cost per 1,000 views. If the job is to move people who already know you, weight long-form YouTube, and measure on engagement and the actions that follow it, such as tagged-link clicks. When a campaign has to do both, Reels are the safer default, since they lead on impressions and sit second on engagement, at 5%.
These are marketplace averages, one impressions figure and one engagement rate per format. The report names the interactions it counts without giving a formula, and its impression figures are rounded, so use the multiples to choose a format and set each creator's benchmark from their own recent posts.
How to Measure Influencer Marketing in Four Stages
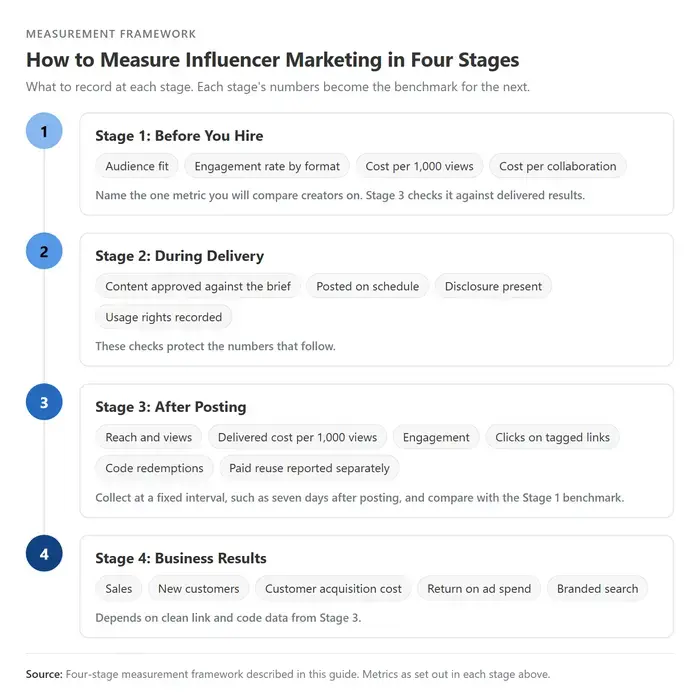
Measure influencer marketing in four stages: before you hire, during delivery, after posting, and business results. Each stage's numbers become the benchmark for the next. To set goals first, see our influencer marketing strategy guide.
Stage 1: Before You Hire
Before you hire, record audience fit, engagement rate by format, cost per 1,000 views and cost per collaboration. Then name your decision metric, the one number you will use to pick creators, since Stage 3 checks it against delivered results.
• Decision metric in the brief. Our campaign brief template has a campaign goal section where you can name it.
• Audience fit. Ask for a screenshot of the creator's audience insights: location, age range and gender split. A low cost per 1,000 views counts as a saving only when that audience matches your buyers.
• Engagement rate. Use the Instagram engagement rate calculator or the TikTok engagement rate calculator to compare creators on the same platform. They give a profile-level rate, so compare post results within one format in Stage 3.
• Cost per 1,000 views (CPM). Divide the creator's price by their average views per post, then multiply by 1,000. Record it for comparison with delivered views.
• Cost per collaboration. Check it against budget and the number of creators you need. The influencer price calculator shows average creator rates by platform, category and follower count, and our guide to nano vs micro compares the two smaller creator groups.

Stage 2: During Delivery
During delivery, track four things: content approved against the brief, posting on schedule, disclosure present and usage rights recorded. These checks protect the numbers that follow.
• Content approved against the brief. Track revisions requested and whether the final asset matches the agreed deliverable. On Collabstr, payment is released when you approve the work, so approval doubles as your quality checkpoint.
• On schedule. Record the agreed posting date and the actual one.
• Disclosure present. Confirm the post follows Federal Trade Commission (FTC) disclosure guidance for influencers (FTC, 2019).
• Usage rights recorded. Note whether you can reuse the content in ads and for how long. On Collabstr, you can confirm usage rights with the creator in Collabstr's messages, which are open on all plans once the creator accepts (Collabstr).
Stage 3: After Posting
After posting, compare each creator's delivered results with the benchmark you recorded in Stage 1. Collect them at a fixed interval, such as seven days after posting, so every creator is measured on the same clock.
• Reach and views. Ask each creator for a screenshot of native post insights on the reporting date.
• Delivered cost per 1,000 views. Recalculate CPM on actual views and compare it with your Stage 1 estimate. Creator A from the introduction had a pre-hire estimate of $20 per 1,000 views. If the post earns 16,000 views, the delivered figure is $25 per 1,000 views ($400 ÷ 16,000 × 1,000), 25% more than estimated.
• Engagement. Compare the post's engagement rate with the creator's profile rate and with their other posts in the same format.
• Clicks. Give each creator a tagged link built with campaign parameters added to the web address (URL) (Google Analytics Help, 2026), so traffic shows up by creator in your analytics.
• Codes. Issue one unique code per creator. Our guide to influencer affiliate marketing covers pairing codes with base pay.
• Content reuse as ads. If you run the content through influencer whitelisting, report paid results separately from organic.
Stage 4: Business Results
The last stage ties creator activity to revenue: sales, new customers, customer acquisition cost (what each new customer cost you), return on ad spend (revenue for each ad dollar) and branded search (searches for your brand name). It depends on clean link and code data from Stage 3.
For the calculations, see measuring ROI, tracking influencer ROI and ROI on a budget. For targets, see influencer marketing key performance indicators (KPIs).
Influencer Marketing Metrics by Goal
The right influencer marketing metrics follow the goal: cost per 1,000 views for awareness, engagement rate for consideration, audience fit for conversion and cost per collaboration for content. Pick the decision metric first, then carry it through every stage. The proof metric is what you check after posting to see whether that choice paid off.
|
Goal |
Decision metric before hiring |
Proof metric after posting |
Business metric |
|---|---|---|---|
|
Awareness |
Cost per 1,000 views |
Reach, views, delivered CPM |
Branded search, new visitors |
|
Consideration |
Engagement rate by format |
Saves, shares, comments, link clicks |
Site sessions, email signups |
|
Conversion |
Audience fit |
Tagged-link clicks, code redemptions |
Sales, acquisition cost, return on ad spend |
|
Content |
Cost per collaboration |
Assets approved, usage rights secured |
Results of the content when reused in ads |
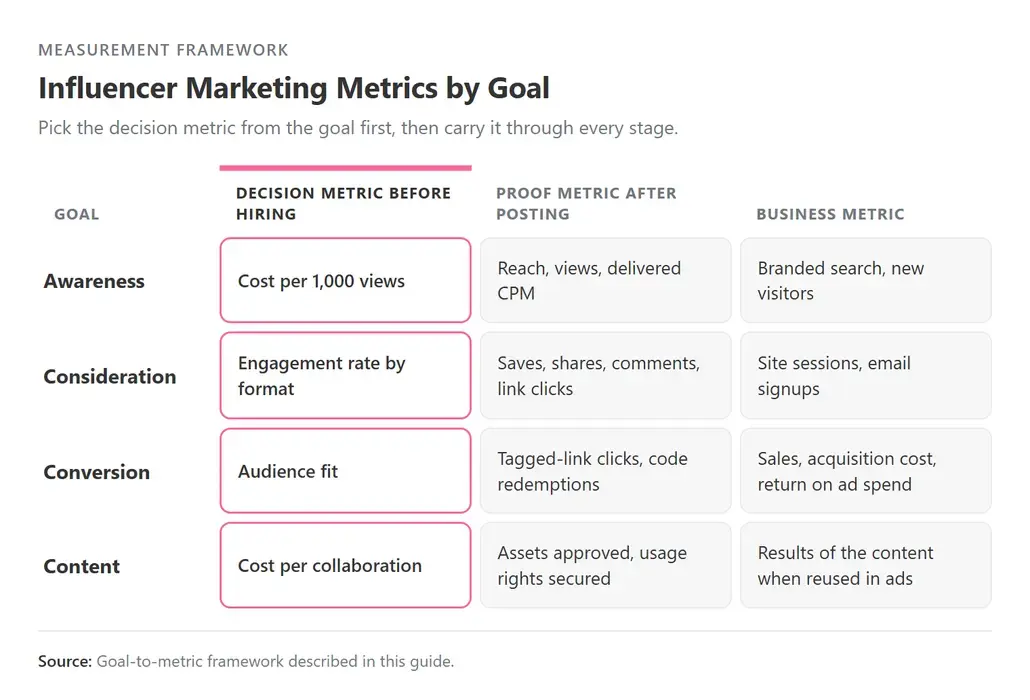
Because each goal uses a different decision metric, the same creators can rank differently. An awareness campaign judged on engagement can underrate formats with wide reach, and a consideration campaign judged on views can overrate them. For awareness campaigns, earned media value turns delivered views into an ad-equivalent figure, priced at a CPM you choose.
Set Up Tracking Before the First Post Goes Live
Set up tracking before anything posts, so every creator is measured the same way. It needs a link-tagging convention, a report template and one shared place for results.
• Agree one tagging convention for every creator link, plus one unique code per creator.
• Build the report template with fixed reporting dates and a benchmark column for Stage 1 estimates.
• Store screenshots and link data in one place, such as an influencer analytics tool or a shared spreadsheet.
Common Measurement Mistakes
Four mistakes distort creator comparisons:
• Reporting on different dates. A post measured after three days and another after 30 cannot be compared.
• Blending organic and paid results. Paid reuse inflates reach, so keep it on its own line.
• Judging a content collaboration on views. A content collaboration buys the asset, so judge it on approval and usage rights, and measure results where you run it.
• Changing the decision metric after results arrive. Pick it in the brief and keep it through the report.

What This Means for Brands
Each metric favors different formats, and so different creators, so choose it from the goal before you compare a single profile.
Start with the goal-to-metric table, set up links and codes before anything posts, and measure every creator on the same clock. On Collabstr, each creator profile shows a starting price for each content type before you hire, and payment is released when you approve the work.
FAQ
How Do You Measure Influencer Marketing Success?
Start with the campaign goal, then choose one decision metric for it:
• Awareness: cost per 1,000 views.
• Consideration: engagement rate.
• Conversion: audience fit, then tagged-link clicks and codes to prove it.
• Content: cost per collaboration.
Record that metric before hiring, confirm delivery, collect post insights on a fixed date, then connect clicks and codes to sales.
What Are the Most Important Influencer Marketing Metrics?
The most important metric is the one tied to your campaign goal, drawn from a core set of reach, views, engagement rate, clicks, code redemptions and cost per 1,000 views. In Collabstr's 2026 report, the metric changes which format looks best: Instagram Reels drew 150 times the impressions of YouTube videos, while YouTube videos led on engagement (Collabstr, 2026).
How Do You Track Sales From Influencer Campaigns?
Give every creator a unique tagged link and a unique discount code, so each sale can be traced to one creator. Tagged links send traffic data into your analytics tool, while codes capture buyers who never click. Report organic and paid reuse separately, over a set reporting window.
Is Cost per Collaboration or Cost per 1,000 Views the Better Metric?
The goal decides. Cost per collaboration fits content goals, where you are buying assets, and cost per 1,000 views fits awareness goals, where you are buying reach. Compare creators on the one that matches the goal, and record the other as context.
Why Recalculate Cost per 1,000 Views After a Post Goes Live?
A pre-hire estimate uses the creator's average views per post, and a single post can land above or below that average. Recalculate on the views the post actually earned, then compare the delivered figure with your pre-hire estimate.
Methodology
• Format demand, impressions and engagement by format come from Collabstr's 2026 Influencer Marketing Report. The report dates its most requested formats to 2025, charts a rounded impressions figure for each format (TikTok videos and Instagram posts are tied), and names the interactions it counts in engagement without giving a formula. Read from the live report and its charts on September 16, 2026.
• Impression multiples are each format's rounded figure divided by the YouTube videos figure, our calculation. The figures themselves are not printed.
• Chat, approval and starting prices are described on Collabstr's feature pages, read on September 16, 2026.